HRLocker has integrated Gender Pay Gap reporting as part of our standard suite of reports available to all HRLocker customers.
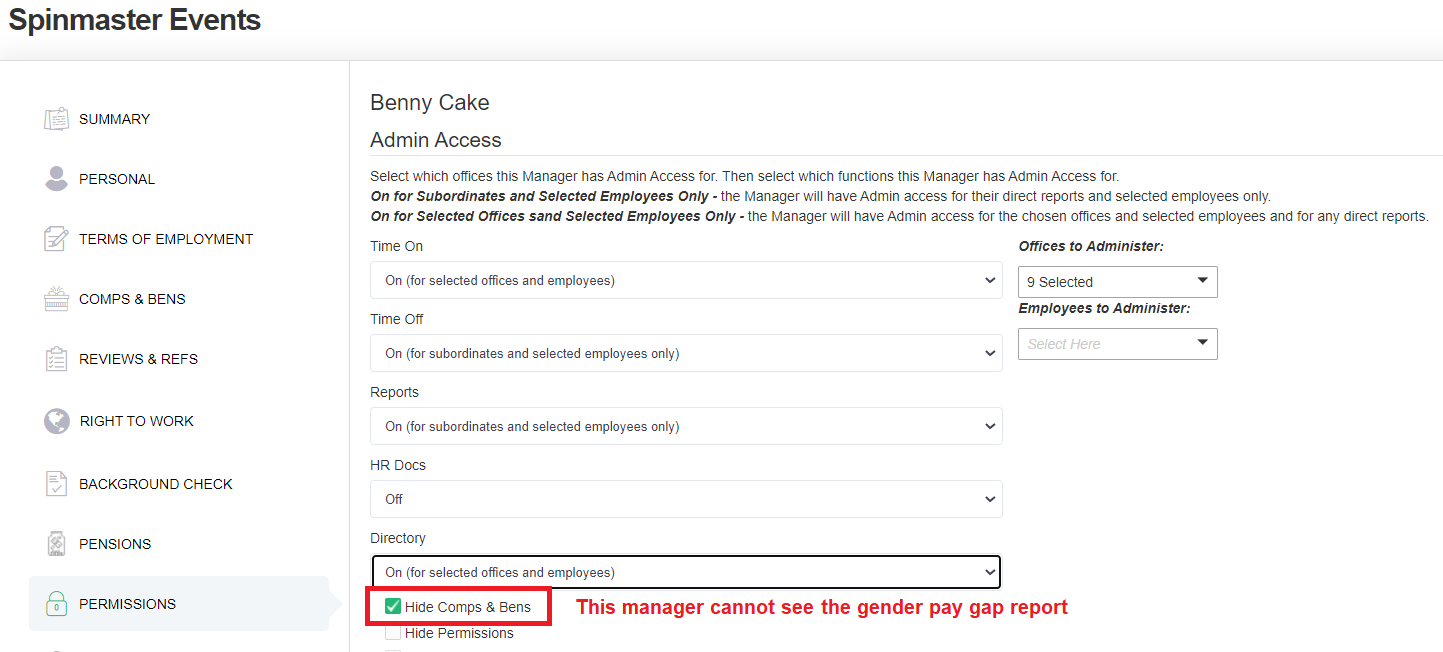
To access this report, you need to be either a HRLocker Admin, or a Manager user type who has been granted permission to access reports and the directory.
Managers and Admins who have 'Comps and Bens' hidden in their permissions cannot see this report.
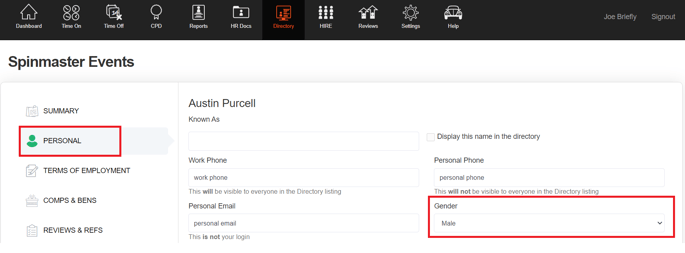
In order to use this report, you need for your employee's directory information to be updated to include their Gender. This can be set as either Male, Female or Undefined.
If an employee has their gender set to undefined, it will not be included in the report.
Employees can do this themselves by logging into HRLocker and editing the 'Gender' section in the Summary tab, or Managers can complete this on their behalf.
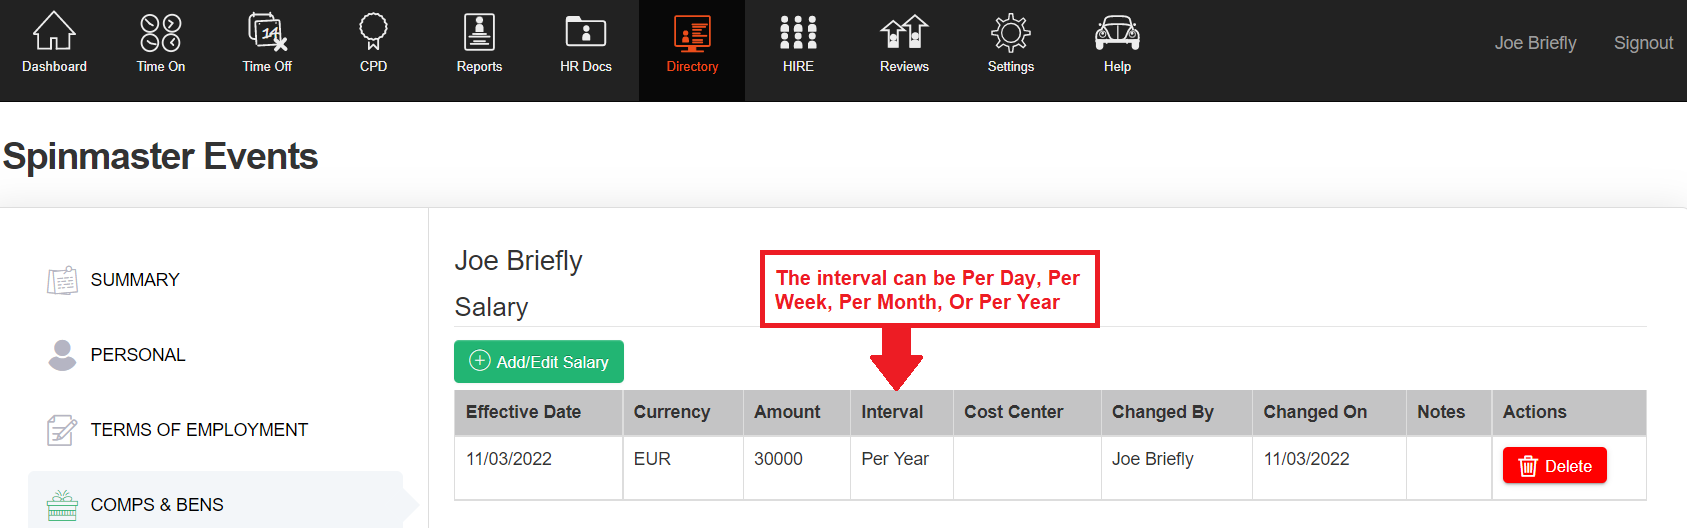
Employees will also need to have salary information uploaded to HRLocker in order to populate this report. Managers and admins can update these records in the 'Comps and Bens' section of HRLocker.
Salaries can be added based on an Hourly, Daily, Weekly, Monthly or Annual rate.
The Gender Pay Gap report will compare all your employee's even if they are paid on a different interval.
The report will take the newest salary that falls within the 12 month period of the report.
The report also includes any bonus or benefit that is effective within the 12 months prior to the selected date.
This report converts salary, benefits and bonuses to an hourly value.
Full time employees who are paid a salary and recorded in the Comps and Bens section as their Yearly Salary are assigned a standard working year of 2080 hours, so their salary plus bonuses and benefits are added together and divided by 2080. Monthly
If the employee is not a full time employee, then the 'Full Time Equivalent' field in the Terms of Employment page needs to be populated with their FTE percentage value (eg, someone working half the standard hours should have a FTE value of .5)
A blank FTE value is considered a full time worker, even if their employment type is 'part time'
This report is run for the 12 months prior to the date selected.
It can be filtered by Office, Department and Team.
It can be further filtered by employment type, salary type, length of service and country of residence.
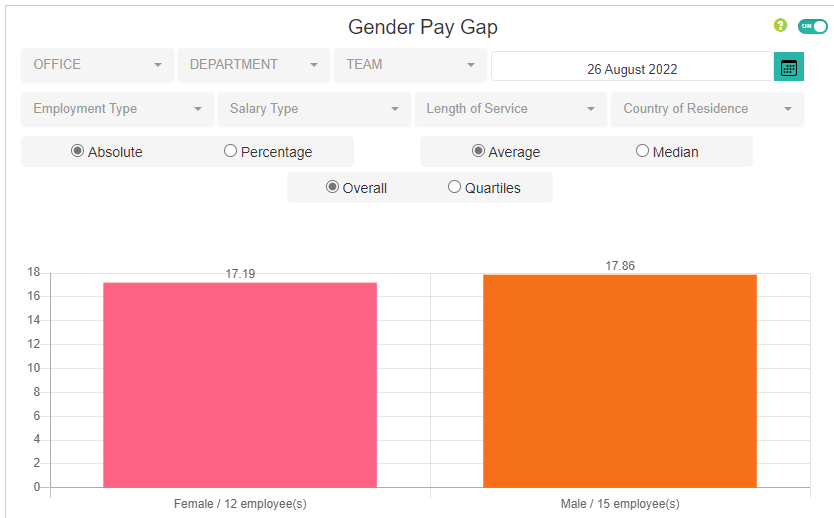

The report can then be shown in Absolutes or Percentage. Absolute showing the monetary value.
Choose between Average (also called 'Mean'), or Median. Median being the middle point between the lowest and the highest salary
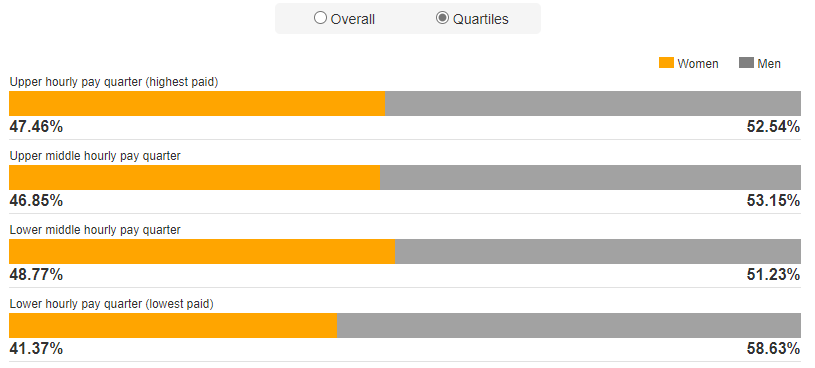
The report can also be shown as an Overall result, or in Quartiles.
The quartile range takes the total number of employees who are active in your company and puts the employees into 4 categories. The 25% lowest paid employees, the 25-50% lowest paid employees, the 25-75% highest paid employees and the top 25% paid employees.
Downloading the report
Due to the dynamic nature of the report and all the filters that can be applied, this cannot be downloaded in excel.
To use this report for compliance purposes, you can take screenshots of the report on a windows device using the 'Snipping tool 
For Audit purposes, the raw data used to compile the report is stored in 2 reports, the Directory Export report and the Salary History report which can both be see here